Artefact Two - Data Representation
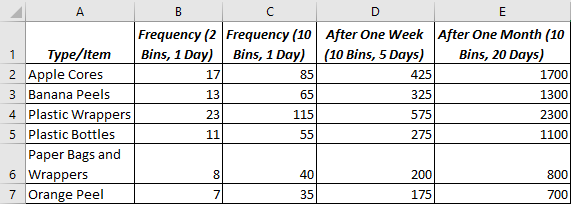
Excel Spreadsheet:
Constructed Graph:

Explanation of Representation:
The data in the table above has been displayed in a way that is easy to understand. However, in order to complete the other questions for this task, we had to determine the amount of rubbish that would be found over 10 bins for one day using the information provided. The information given showed us how much rubbish was found in two bins over one day, meaning we had to use this as an estimate to find the amount in ten bins. This was done by dividing the amount for 2 bins by 2 (finding half) and then multiplying that number by 10 (to find rubbish for 10 bins). This procedure is shown below.
The data in the table above has been displayed in a way that is easy to understand. However, in order to complete the other questions for this task, we had to determine the amount of rubbish that would be found over 10 bins for one day using the information provided. The information given showed us how much rubbish was found in two bins over one day, meaning we had to use this as an estimate to find the amount in ten bins. This was done by dividing the amount for 2 bins by 2 (finding half) and then multiplying that number by 10 (to find rubbish for 10 bins). This procedure is shown below.

Once this figure was determined, we are able to continue with the remainder of the activity. The next two questions asked us to determine the total amount of each item from the whole school over a week and then over a month. When doing this question, I assumed that the question would be referring to a school week (5 days) meaning that a month would be equal to 4 weeks (20 days). The amounts listed in the table above were calculated using basic formulas on excel that could be applied to all items. Please see below the two formulas for each column.


With this Excel activity, one can develop insight into data representation and pattern searching in the classroom by getting students to collect the data and create their own representation of it. This way, students can recognise which items seem to be the most common in their rubbish and also create meaning of the data being presented.
Overall Reflection:
There are many different activities that can be completed on Excel that are suitable for all skill levels. The activity completed above can be used in all year levels, with modified aspects, to develop insight into data representation and pattern searching in the classroom. To complete this activity, or similar, in a Year 4 classroom, some areas need to be altered to ensure that the activity helps reach the intended learning outcome. A question that could be posed to the students in my classroom for this activity could be, ‘What is the most common type of waste collected from 4D’s rubbish bin?’. This question allows students to discover the most common type of rubbish collected after one day, and also gives students a chance to address the problem of waste in the school. To assist the students in choosing the best way to answer the question, 4D could have two separate bins with a tally sheet next to them. When students put their rubbish in the bin, they must put a tally mark next to the type of rubbish that their rubbish fall under. After one day (first and second break), the students will collect the tally sheet and will be able to determine the most common type of rubbish from their lunchboxes. The data can be collected for more than one day, allowing students to choose how long they investigate the amount of rubbish their classroom produces.
Once the data has been collected, students will be encouraged to choose the most suitable way to effectively present the data. Before they display their data, the students will be shown a number of different ways that they can present the information they have collected. This means that they will learn how to create a graph both manually (by hand/graph paper) as well as using technology (excel spreadsheets). As technology is becoming a major part of our lives, it is likely that students will be more interested in using a program on the computer to show the data they have collected. After students have constructed their graph and displayed the data in their chosen way, students will be posed with questions that relate to the data. These could be questions regarding the most common type of rubbish, the least common type of rubbish, why these most/least common types of rubbish and what they can learn from the data. This allows students to read the data and interpret it to answer questions about what the data tells them. As a teacher, this data can be used to spark an interest in the amount of waste that is produced by the whole school in one week. The data from this activity only shows the rubbish from one classroom for a week, therefore, students may gain an interest in finding out the amount of rubbish that the whole school generates in one week. This also allows the teacher to build interest in the amount of rubbish that a school contributes to landfill.
Data and representing data is something that can be covered in all year levels. When looking at the Digital Technologies learning area of the Australian Curriculum, it is clear that this has become a large part of education. Each year level has different learning outcomes that are expected to be achieved by all students by the time one finishes a certain year level. In year levels Prep/foundation to Year 2, students are introduced to data and are encouraged to explore the patterns they can see and use digital systems to present the data. This means that students are able to identify how common digital systems, both hardware and software, are used to meet specific purposes, and can use digital systems to represent simple patterns in data, in different ways (ACARA, 2017) by the end of Year 2. When students move into Grades 3 and 4, students begin to recognise the different types of data and how it can be represented in different ways, as well as using simple software to create information and solve problems. This allows students to be able to describe how a range of digital systems and their peripheral devices can be used for different purposes and explain how the same data sets can be represented in different ways by the end of Grade 4 (ACARA, 2017). In a student’s final years of primary education, Year 5 and 6 students will learn how to acquire, store and validate different types of data, while using a range of software to interpret and visualise data. Upon completion of Year 6, students will have the ability to explain the fundamentals of digital system components and also explain how digital systems use whole numbers as a basis for representing a variety of data types (ACARA, 2017). Clearly, each year level in the primary stand has aspects of data representations, meaning that this activity, or one that is similar, can be modified to fit the content learning descriptions in the Australian Curriculum.
